
Global API Market: Crunching the Numbers
Synthetic APIs, referring to pharmaceutical fine chemicals (APIs and intermediates), dominate the global API market, accounting for more than 80% of the global API market. How is the market growing, and what are key trends in API demand and global supply?
Global API market: crunching the numbers
The global market for active pharmaceutical ingredients (APIs), at an API level, is showing moderate growth, with synthetic APIs, referring to pharmaceutical fine chemicals, or chemically synthesized APIs and intermediates dominating the market.
The global API market (both synthetic APIS and biologic-based APIs) was valued at $187 billion, according to 2021 report, The Evolving APIs World: Crunches in the Global APIs Supply Chain, by the Chemical Pharmaceutical Generic Association (CPA), which represents Italian manufacturers of active ingredients and intermediates for the generics market. The market has increased from $98 billion in 2007 to $187 billion in 2020, representing 5.1% annual growth. Of this total, synthetic APIs continue to dominate the market, accounting for 83.4% of the global APIs market, or $ 156 billion in 2020: of this total, intermediates accounted for approximately 20%, or $30.8 billion (see Figure 1).
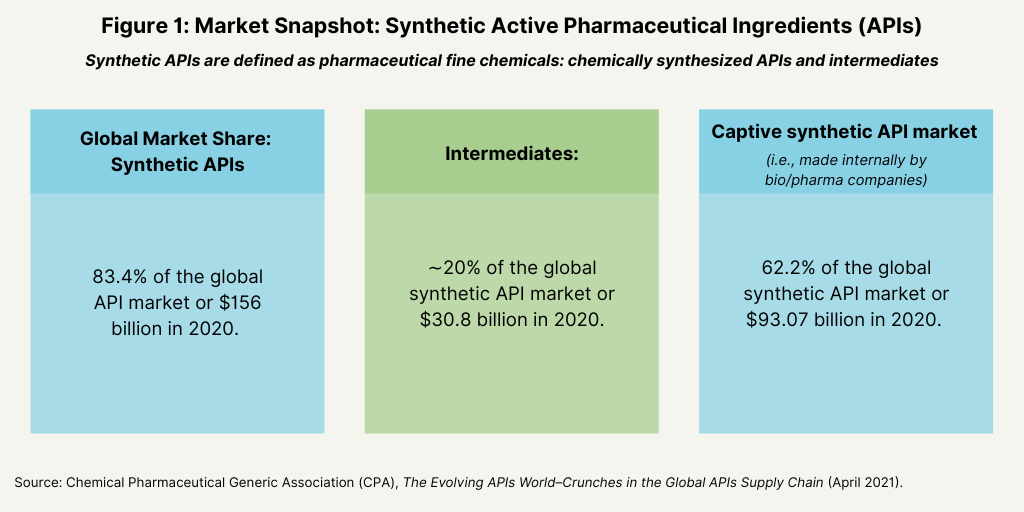
Captive synthetic APIs, referring to chemically synthesized APIs and intermediates manufactured internally by bio/pharmaceutical companies, dominate the synthetic API market, accounting for 62% of the global synthetic API market, or $93 billion in 2020 (see Figure 1). Although synthetic APIs dominate the global API markets, biologic-based APIs are experiencing more rapid growth. Biologic-based APIs accounted for 16.6% of the global APIs market in 2020, or $31 billion, but are the fastest growing segment in the global API market. The market for biologic-based APIs increased on average at 7.6% per year over the period 2007–2020, outpacing the 5.1% annual growth seen in the overall global API period during that same period.

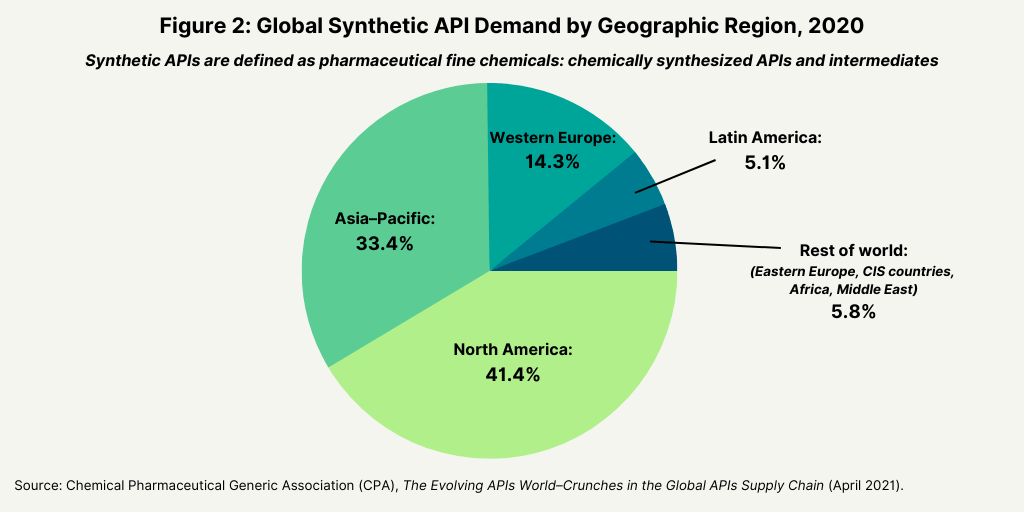
Looking at demand of synthetic APIs from a geographic perspective, North America (41.4%), Asia–Pacific (33.4%), and Europe (14.3%) are the three largest markets (see Figure 2).
Overall industry growth; key trends
Growth in the global API market is tied to overall bio/pharmaceutical industry growth, which experienced some shifts in demand patterns due to the COVID-19 pandemic. After responding to the COVID-19 pandemic for the past two years, the global bio/pharmaceutical industry is now facing a “new normal” in 2023 that will require changes in commercial strategy and execution (1). Growth prospects are being impacted by several key issues: current healthcare expenditures not being sustainable in real terms, lower net sales resulting largely from discounting in the US market, an upcoming patent cliff resulting in increased generic-drug and biosimilar incursion, and a changing healthcare landscape in the patient–physician–payer environment (1). Despite these pressures, global pharma sales (excluding vaccines), measured at ex-manufacturers’ prices, were above expectations in 2021 in every region, both on a value and volume basis. Overall, global pharma sales increased 8% in value and 4% in volume in 2021, according to estimates from IQVIA. In most regions, growth approximated to the average of 8%. The exception was Latin America, which grew by 20% (as measured at ex-manufacturers’ prices in US dollars). Overall, the global pharma market is projected to reach $1.7 trillion in 2025, excluding vaccines (at constant dollar, ex-manufacturers’ prices), with the US and China representing more than 50% of the global market, according to information from IQVIA (1).
Looking forward, another key issue for overall bio/pharmaceutical industry growth is the near-term fortunes of the generics and biosimilars sector, which will largely rest on one of the largest patent cliffs upcoming over the next five years (2022–2026) with a cumulative brand loss by innovators of $188 billion, according to IQVIA estimates. The resulting revenue opportunities for the generics and biosimilar sectors are significant: $17 billion for generics and $39 billion for biosimilars for the period 2022–2026, according to IQVIA estimates (1).
Branded versus generic APIs
In relating overall industry growth to the global API market, CPA projects stronger growth for generic APIs comparative to branded APIs (i.e., APIs still under patent protection). Overall, the market for generic APIs is expected to grow at an average 6.2% yearly over the period 2020–2024, compared to an average of 3.5% yearly for branded APIs. Brand loss of exclusivity is projected to have a $39 billion negative impact on brand sales over the period 2020–2024, compared to $108 billion in the period 2014–2019.
Supply base for the global API market
There are over 3,000 APIs companies worldwide, of which China accounts for 48.0% and India 19%, according to the CPA analysis. A well-chronicled and continuing trend over the past decades is the increasing shifting of API manufacturing from the highly regulated markets (US, EU) toward low-cost Asian countries, particularly China and India. South Korea is the third largest API manufacturer in Asia after China and India, and the fifth largest API manufacturer in the world, representing 3% of API manufacturers. South Korea has been an API sourcing choice for the strictly regulated Japanese pharmaceutical industry for a number of years, thus pushing local APIs companies to develop
innovative quality manufacturing processes, according to the CPA analysis. Among other Asian countries, Taiwan is emerging as a “second wave” of API suppliers, albeit from a low base, with about 1% of global API companies there. Among developed markets, Western Europe accounts for nearly 11% of API manufacturers globally, the US nearly 6%, and Japan 5%, according to the CPA analysis.
China has a dominant position in the global API supply chain largely due to its supply of intermediates. About 80% of intermediates used worldwide for API manufacturing are produced in China (mostly chemical APIs and generic API, bulk size for lower valued APIs), according to the CPA analysis. For certain antibiotics, such as cephalosporin, azithromycin, and penicillin or certain other generic APIs, China’s share of the global API market can reach 90–95%. China is a leading supplier of intermediates to developed markets, such as the US and Europe, but it also a major supplier of intermediates to India (see Figure 3).
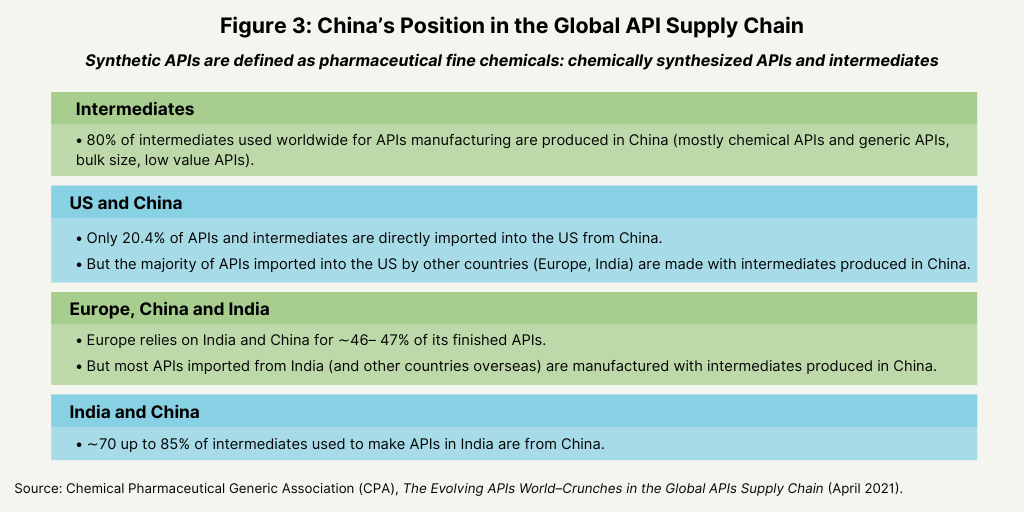
For generic APIs, the US is small producers of generic APIs, and lower-valued bulk APIs are mostly imported. In the US, while only about 20% of APIs and intermediates are directly imported from China, the majority of APIs imported into the US from other countries (Europe, India) are made with intermediates produced in China. Approximately 26% of API manufacturing companies supplying the US market are based in the EU, but the majority of intermediates used by EU-based companies for the production of their APIs come from China, according to the CPA analysis. In Europe, the reliance on China is in the range 75–85%. Tn terms of finished APIs, the reliance upon India and China is approximately 46–47%; but, once again most APIs imported from India (and other
countries overseas) are manufactured with intermediates produced in China, according to the CPA analysis. Although India is a large producer of APIs (mostly generic APIs), about 70% up to 85% of India’s need of intermediates used to produce APIs in the country is covered by China, according to the CPA analysis.
Reference
- P. Van Arnum, “Pharma Industry Outlook: The Challenges and Opportunities,” DCAT Value Chain Insights, April 7, 2022.